Overview
The product that had to work at 2am
Serēna is an AI-powered mental health support app designed for Latinx communities — bilingual, culturally personalized, and built to bridge the gap between crisis moments and professional care.
The constraint that shaped every decision: this product had to work for someone in the middle of a panic attack who had never been taught to prompt an AI effectively.
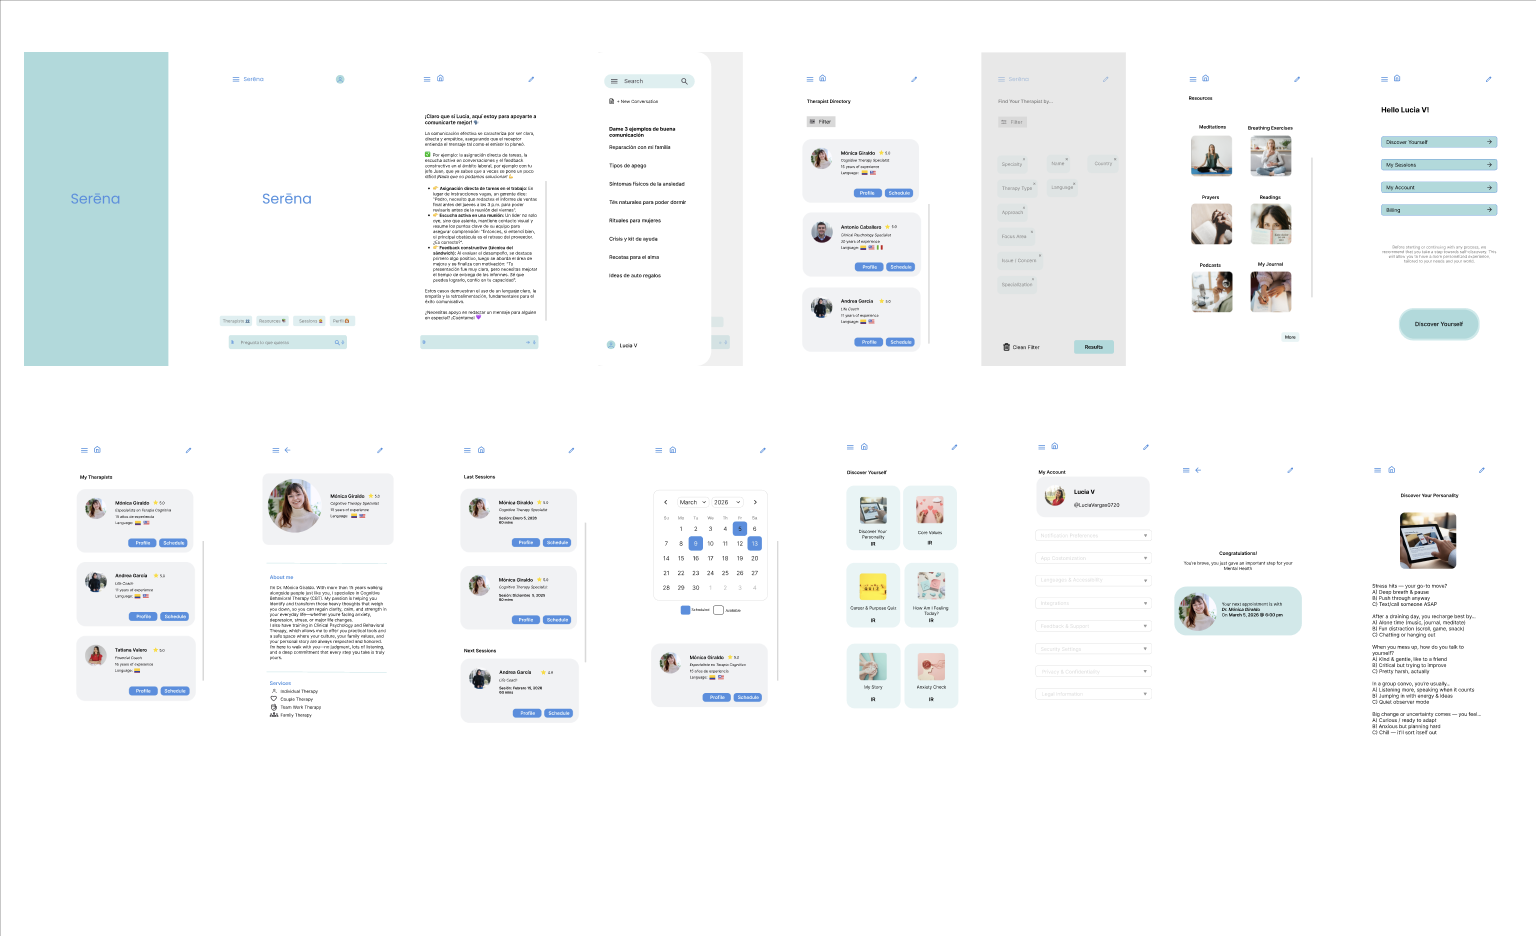
21 screens. The full product, before users told me what was broken.
The Problem
What happens when the person in crisis doesn't know how to ask for help?
Serēna began with a firsthand observation. During a personal crisis — without access to a therapist — I turned to AI for psychological support. It worked, with conditions. Years of therapy had given me the literacy to engage it meaningfully: I knew how to frame a question, how to push past a generic response, how to recognize when the AI was being complacent rather than honest. Most people don't have that foundation.
And most Latinx users carry an additional layer of barrier: cultural stigma, language gaps, and distrust of systems that have historically excluded them.
The existing apps addressed none of this. They were too clinical, too generic, or too expensive. They required onboarding when someone was already overwhelmed. They offered AI or therapists — never both.
Only 16.4% of Hispanic adults received mental health treatment in the past year. That number isn't about awareness. It's about access, trust, and the absence of a product that actually speaks to who they are.
The design problem wasn't "build a mental health chatbot." It was:
How do you design trust before you design features?
16.4%
Hispanic adults who received mental health treatment in the past year
35.1%
Hispanic adults with mental illness who receive treatment — vs 46.2% overall
Only 11.7%
Successfully connected to care in one urban Latinx community study
Hypotheses & Approach
The bets I made — and the one I had to kill
Three bets made at the start of this project. Two held. One evolved.
AI and therapists are complements, not competitors.
The app needed to work at 2am during a crisis and also connect users to licensed professionals when the situation required it. Neither alone was enough. A chatbot without human escalation is a liability. A therapist directory without immediate support is a gap.
Cultural personalization is a trust mechanism, not a feature.
Users needed to feel recognized before they felt supported. Language preference, cultural context, communication style — these weren't personalization options. They were the foundation of the product's credibility.
Guest Mode wouldn't compromise personalization — it would unlock it.
Research proved that users in crisis didn't want to create accounts. Guest Mode was introduced, offering immediate access with zero friction. But the product doesn't stop there. Users who create an account unlock a fundamentally different experience: the AI learns their cultural context, communication style, and emotional patterns. The chatbot gets sharper the more it knows. Guest Mode gets someone through the door. An account makes the product actually theirs.
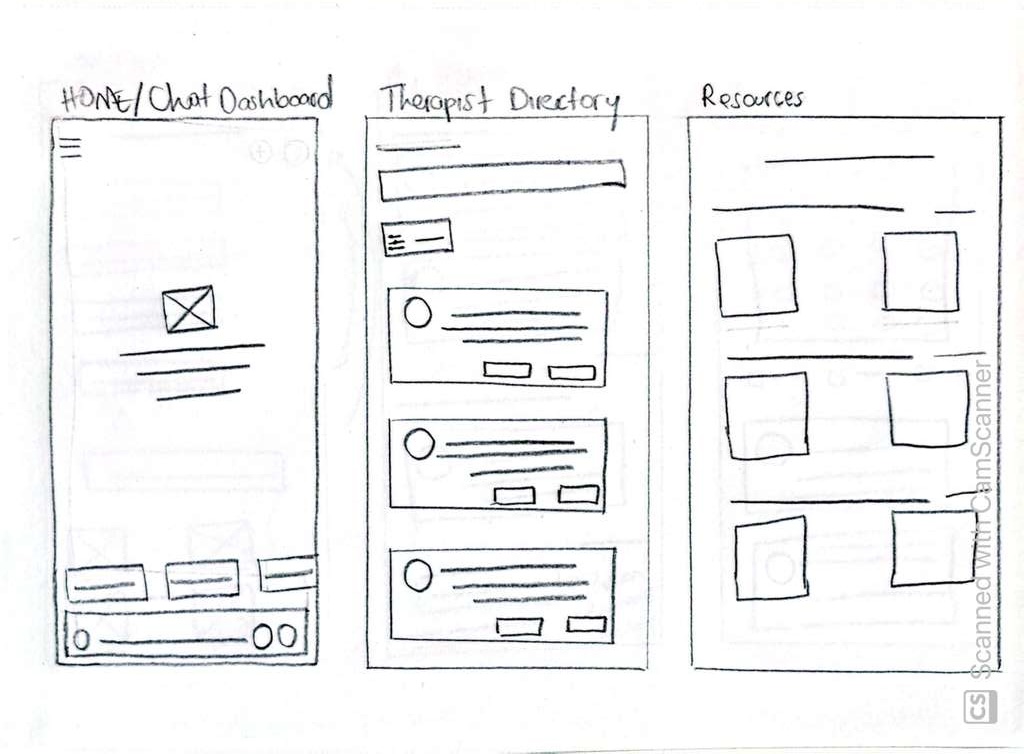
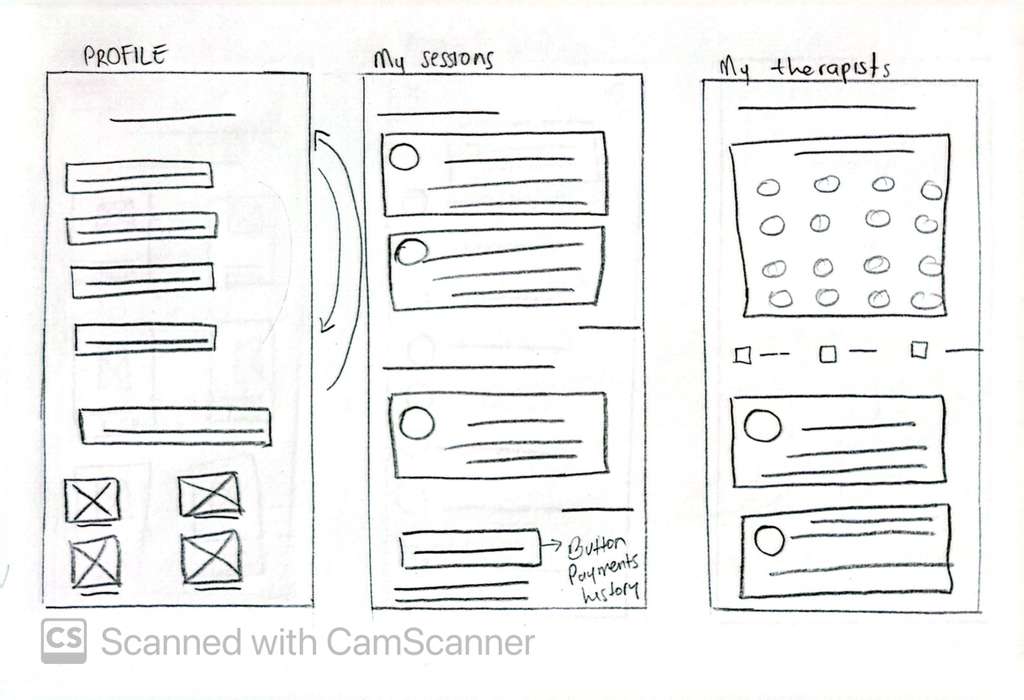
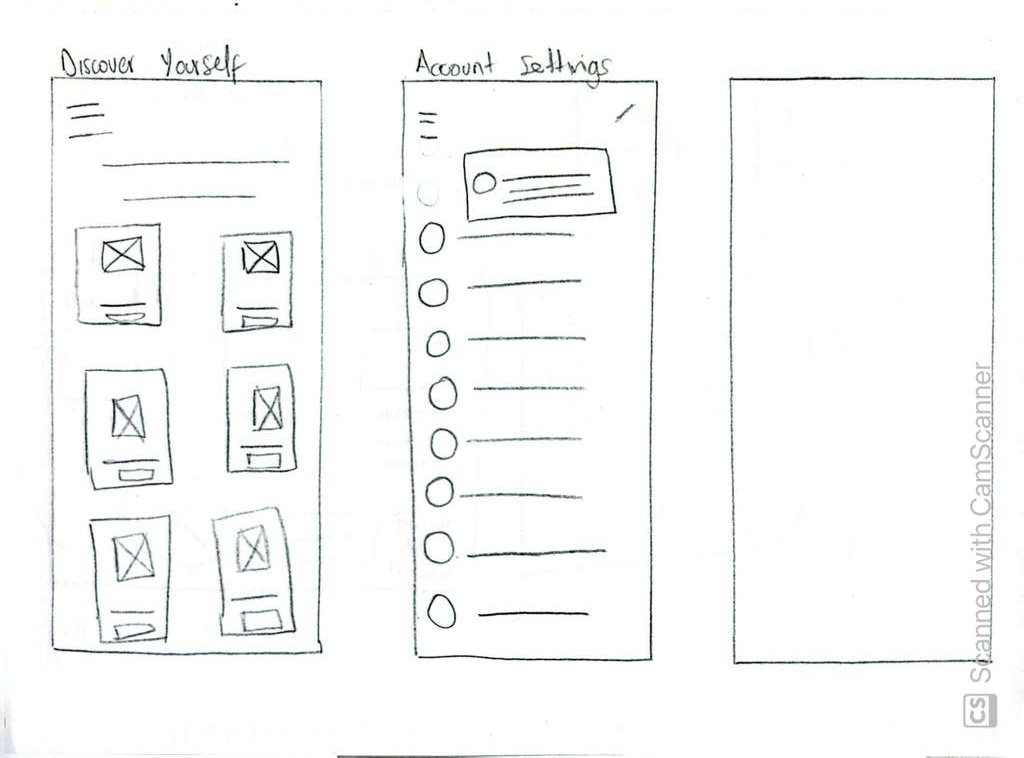
Paper Wireframes
Digital Wireframes
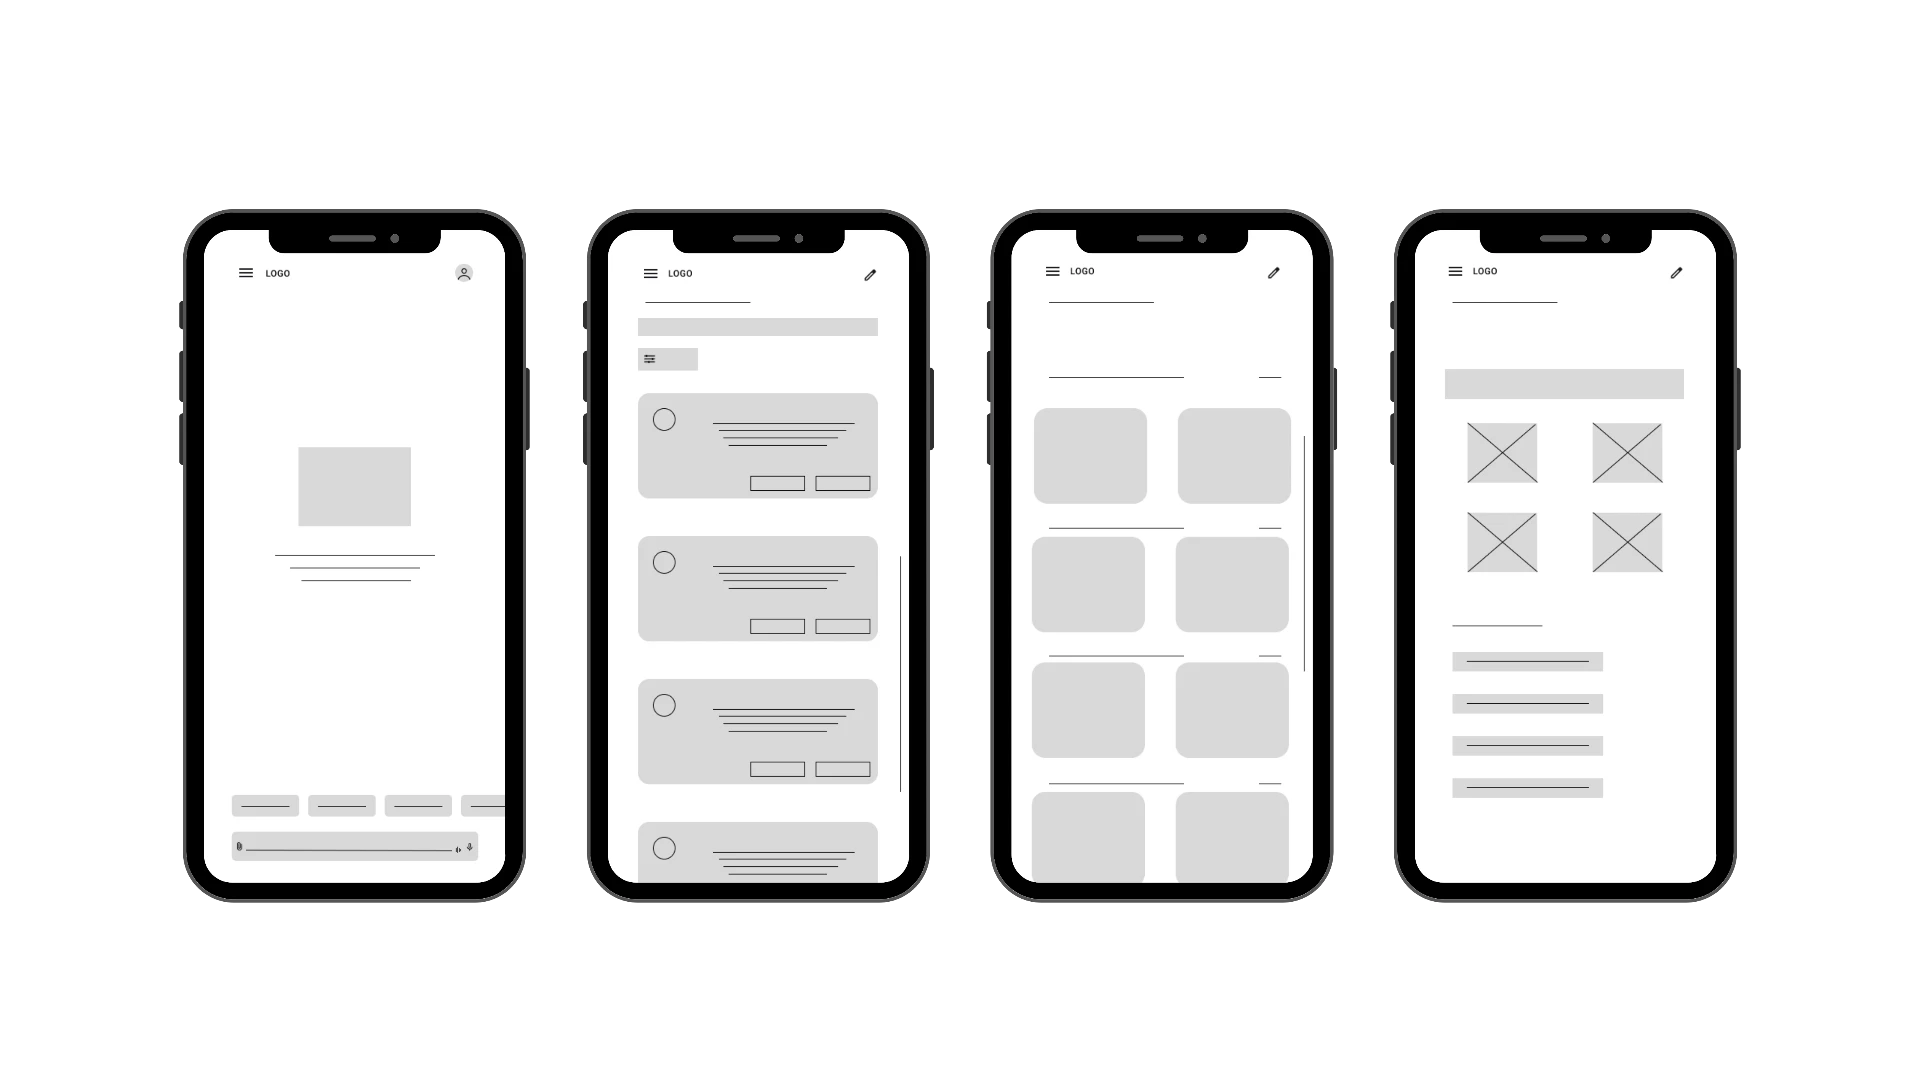
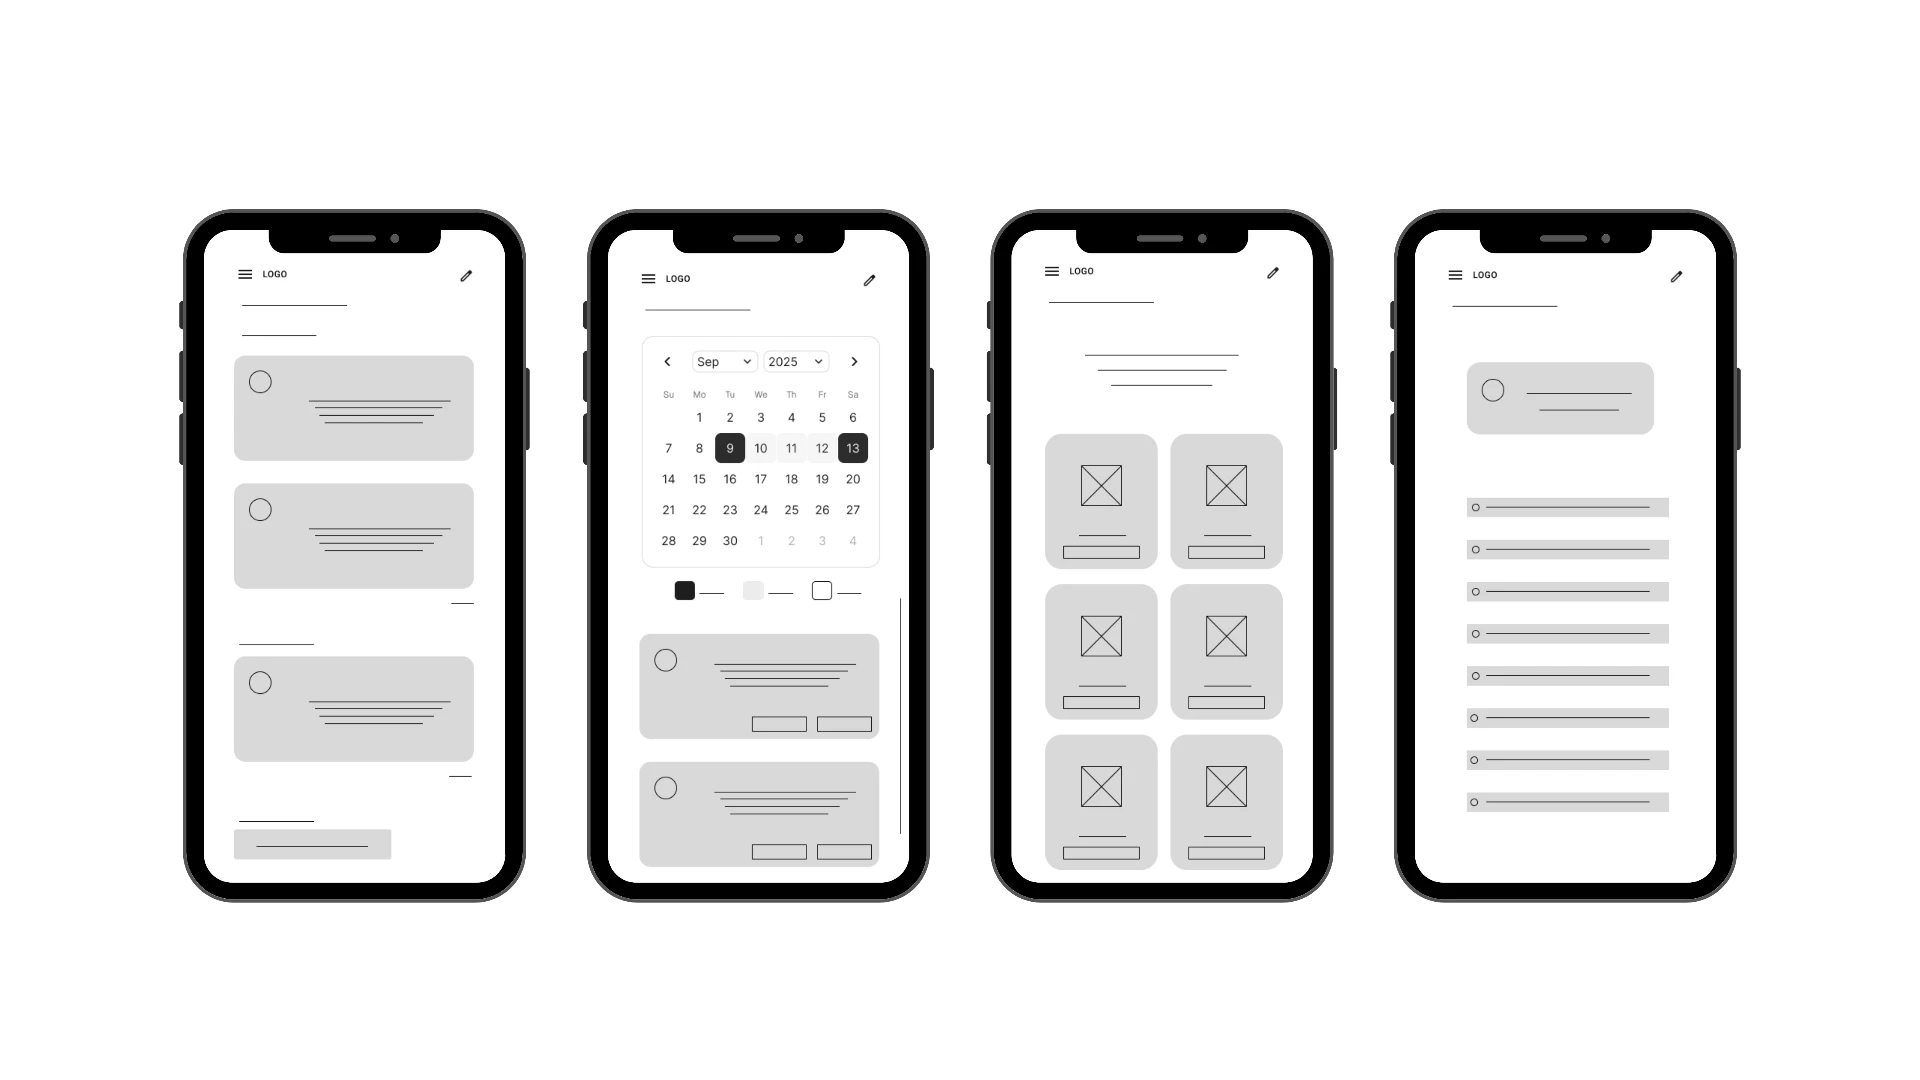
Research & Exploration
What research confirmed, what it changed, and where AI helped
I conducted a mixed-methods research approach combining online surveys and one-to-one interviews with bilingual Latinx adults aged 21–40. Quantitative data captured behavioral patterns and trust indicators. Qualitative interviews captured emotions, fears, and lived experiences around mental health support.
AI-assisted clustering in FigJam organized responses into themes while preserving the nuance of individual experiences. This process transformed raw feedback into actionable insights that directly informed product priorities.
Key finding before any wireframe was drawn: the barriers weren't primarily about cost or awareness. They were about stigma, fear of judgment, and distrust of systems — including AI systems — that might expose vulnerability without protecting it.
Lucia, 18
Colombian university student navigating anxiety without professional support. Time constraints, academic pressure, and cultural stigma keep her from seeking help.
"I need something that understands my culture and is accessible at any time, without stigma."
Mateo, 35
Mexican filmmaker in Chicago managing social anxiety privately. Privacy concerns and cultural stigma prevent him from engaging with therapy or digital tools.
"The stigma is strong in my community, so an anonymous app with expert support would be ideal so I don't feel weak for seeking help."
Research artifacts
USABILITY TESTING
Two rounds. Ten participants. Five task prompts.
Round one was moderated — six bilingual participants via Zoom, think-aloud protocol, 30–40 minutes each. Round two was unmoderated via Maze — ten participants, heatmaps, path analysis, and behavioral data across the same five flows.
The Good
- Cultural Personalization — Users perceived Serēna as emotionally differentiated from standard chat interfaces.
- Resource Exploration — 5.4% misclick rate. Lowest of all five flows. Became the usability benchmark for the rest of the app.
The Bad
- Core Features Discoverable But Not Intuitive — 100% task completion, but high misclick rates revealed navigation friction.
- Cognitive Load — Therapist Directory (63.4% misclick rate, 159.3s avg) and Discover Yourself (61.2% misclick rate, 348.3s avg) were the most friction-heavy flows.
The Confusing
- Trust & Privacy Perception — Users valued the quality of AI responses but hesitated to share personal information.
- The hesitation wasn't about AI capability. It was about data permanence and emotional vulnerability.
Serēna Usability Test Report available to view.
View reportDesign Decisions
What I built, what I traded away, and why
Four decisions that changed the product.
01
Guest Mode
Not my idea. A user's idea. During round one of testing, a participant suggested that someone in crisis wouldn't want to create an account. She was right. I introduced Guest Mode requiring only an email — no profile completion, no onboarding friction.
What was traded away:
Personalization depth on first use. Guest Mode users don't get full cultural tailoring immediately. That's the right trade — getting someone through the door in crisis matters more than optimizing their first session.
02
Navigation Restructure
The hamburger menu was only showing pinned conversations. Users expected a full app menu. Discover Yourself was buried inside the Profile section — users looked for it in Account Settings first, which is where it now lives.
What was traded away:
A simpler menu structure. The restructured nav adds hierarchy — but hierarchy done right reduces cognitive load rather than increasing it.
03
Discover Yourself — From Hidden to Front and Center
Heatmap data from the Figma prototype revealed a critical navigation failure: users couldn't find the Discover Yourself section. The feature was buried inside the Profile bubble — users looked for it elsewhere, generated a 61.2% misclick rate, and in many cases gave up. The heatmaps showed exactly where attention was going instead: scattered, unfocused, frustrated.
What changed:
In the Lovable prototype, Discover Yourself was moved out of Profile entirely and placed as a primary navigation item directly on the dashboard — visible, labeled, and one tap away. The feature went from something users had to find to something they couldn't miss.
04
Dashboard Visual Hierarchy
Heatmaps showed users gravitating to the top-right corner of the dashboard when looking for settings — the avatar icon. It was redesigned and relabeled 'Account Settings' to eliminate confusion with the Profile section.
What was traded away:
Visual minimalism in the nav bar. Adding a label meant more text — but it reduced misclick rate in the highest-friction flow.
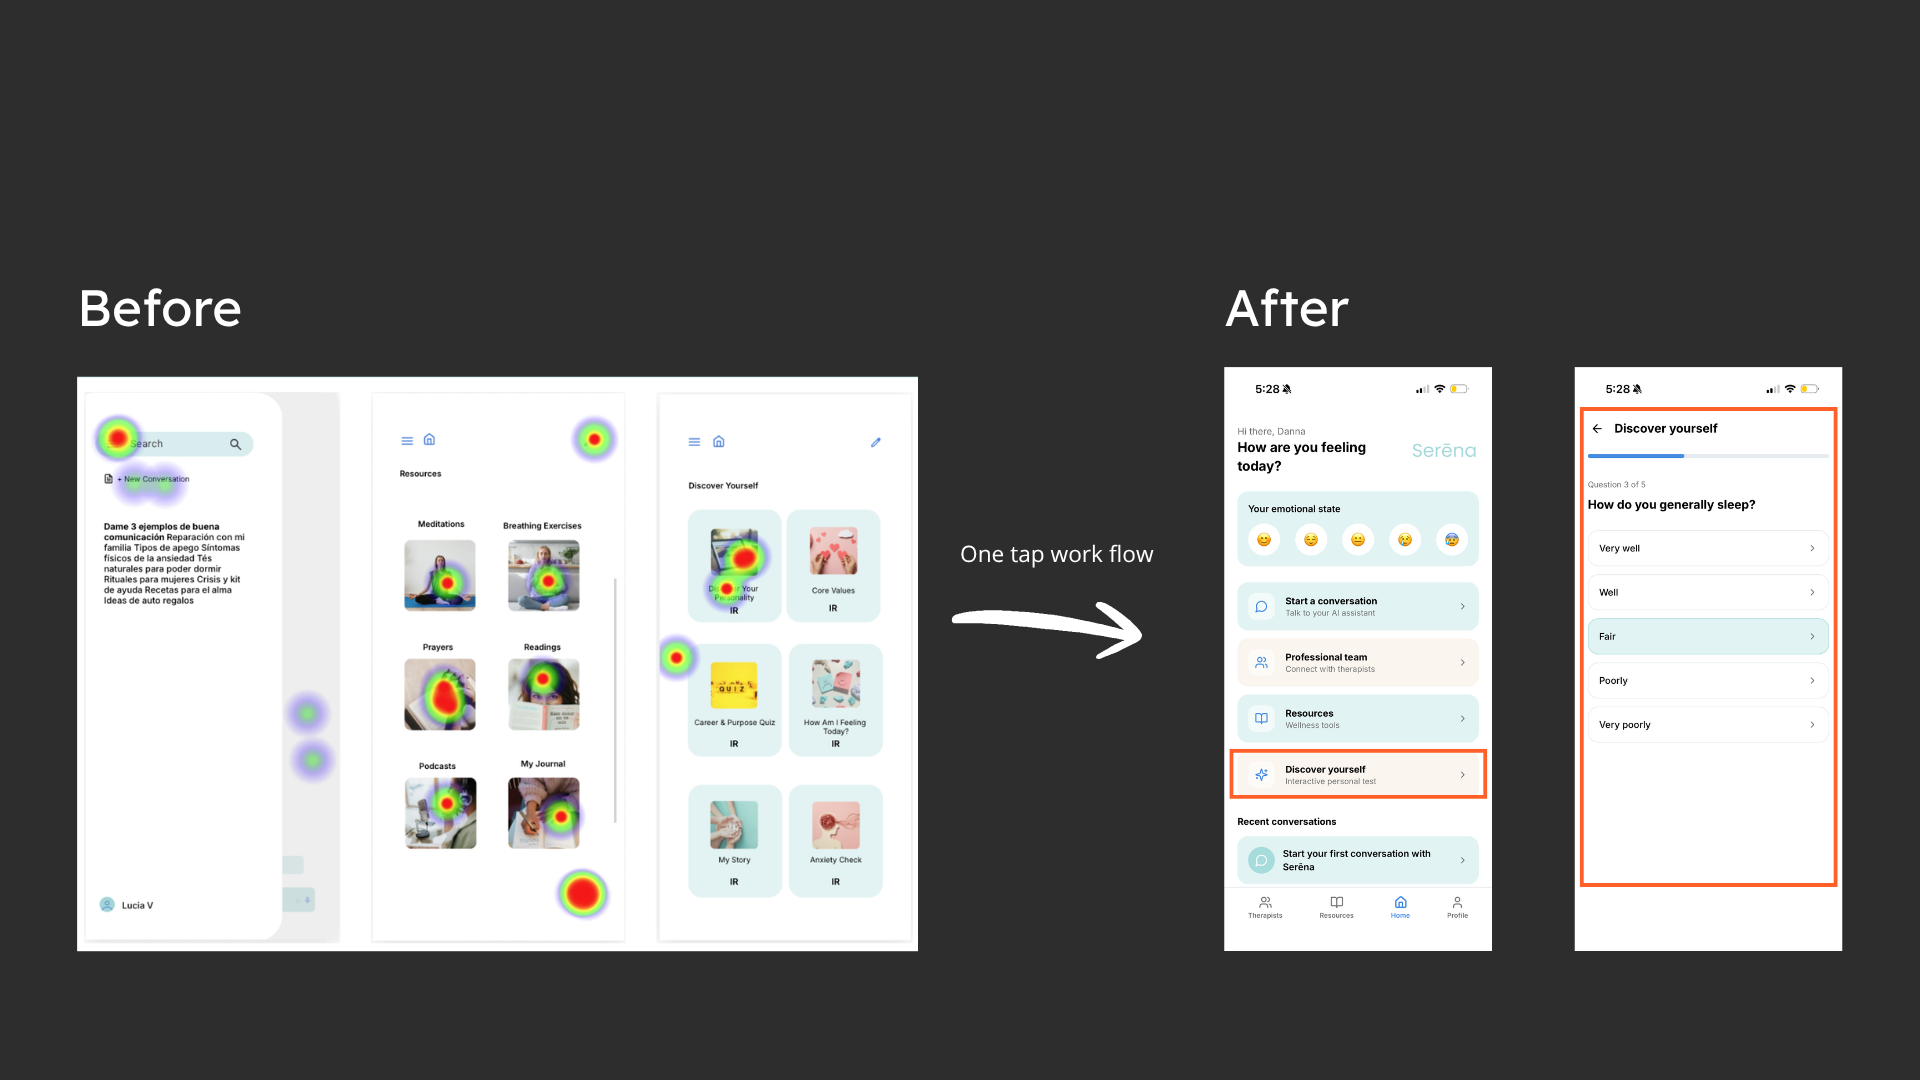
Maze heatmaps on the Figma prototype showed scattered attention and a 61.2% misclick rate on Discover Yourself. In the Lovable prototype, Discover Yourself was surfaced as a primary dashboard action — one tap away.
Where AI worked
AI gave me speed. None of it gave me judgment.
Where I overruled it
—AI couldn't tell me that trust was the real problem — not usability.
—It couldn't decide that Guest Mode mattered more than onboarding completeness.
—It couldn't read a user's hesitation during testing and understand what it meant emotionally.
That part was mine.
Outcomes
What the numbers proved — and what I'd measure next
Serēna is a research-validated prototype. These are the metrics that prove the design decisions worked — and the metrics that would measure success post-launch.
100%
Task completion rate across all 5 usability prompts — no drop-offs
5.4%
Misclick rate in Resources — established as the usability benchmark for the entire app
63.4% → Fixed
Therapist Directory misclick rate — resolved through navigation restructure
01
Feature introduced directly from user feedback — Guest Mode, not from the design brief
In trust-based products, usability and emotional safety are the same problem.